
Flooding is the number one natural cause of fatalities worldwide and was responsible for 6.8 million deaths in the twentieth century.* Today, humans are more vulnerable to flooding due to accelerations in population growth and changes in land-use patterns.* The good news is that our capability to measure water level and communicate those values in real-time has never been better. This case study discusses a Campbell Scientific system that monitors river level and send alerts to decision makers via emails, Twitter, and a web page.
The Schuylkill River is roughly 130 miles long and has a drainage area of 2,000 square miles in Central and Eastern Pennsylvania. About 25 miles upstream of where it joins the Delaware River in Philadelphia is the Upper Providence Township in Montgomery County. In addition to the award-winning multi-use trails along the river, there are, as in most communities, properties (residential and commercial) subject to flooding during significant storm events. Prior to the time this system was designed, the Schuylkill River automated gaging stations nearest to Upper Providence were upstream in Pottstown (about 15 miles) and downstream in Norristown (about 10 miles). Between these two gages are more than 600 square miles of drainage basin.
Knowing the flooding history along this stretch of the river, the township officials identified the need for a local automated gaging station that would provide real-time information and updates about the current water levels in the river. When funding was made available, the fire department and emergency management office worked with Distinctive AFWS Designs to design and build a station that met their needs. After many conversations about system design options, it was concluded that the most effective design would be a gaging station with a built-in web page and notification system.
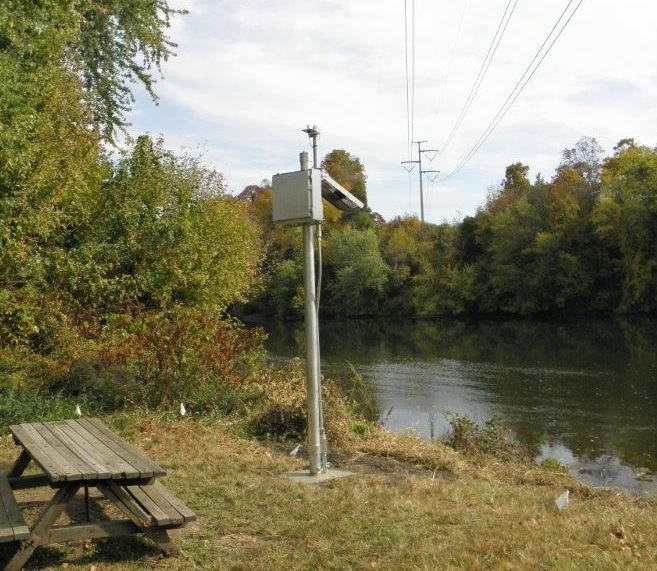
The gaging station consists of a Campbell Scientific CR6 datalogger, a CS451 submersible pressure transducer, a 35 Ah 12 Vdc battery and 20 W solar charging system, and a RavenXT cellular digital modem. Water level is measured every 10 seconds and the datalogger records 1-minute and 5-minute interval averages of the measurements (to dampen out surface turbulence). The logged data is used to populate the station’s internal web page. The web page returns current readings, long-term trends, and alarm states to aid in decision making.
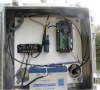
The hydrographs use the 5-minute average, and the River ;Last Reading value returns the latest 1-minute average. The river state (rising, falling, or steady) is determined by comparing the last three 5-minute averages for changes.
Anytime the water level reaches a defined alarm threshold, the datalogger sends out level-specific email and text notifications to emergency responders and public officials. The email/text group list is maintained by the emergency management staff on their email server (not in the gaging station). As a means of ensuring proper operations, at noon daily a heart-beat email is sent out to selected individuals. There are also maintenance-related notifications that can be sent out such as low battery or intrusion.
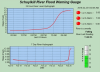
The second page of the station’s web page includes impact statements related to the measured and reported water levels. The elevations for impact were determined after a professional survey was conducted of key hazard points along the river and related back to the water levels that would be measured at the gage.
Both of these web pages were intended for emergency responders and public officials. However, recent extreme flooding events have shown that social media is an important medium for informing the general public about hazardous conditions. Therefore, a Twitter account (www.twitter.com/fwg_Schuylkill) was created for the gaging station and it was configured to send out hourly tweets of the current river level as well as tweeting out whenever an alarm threshold is reached.
In July of 2016 the Twitter page was opened up so that anyone can follow it. In the future, the use of hashtags will be embedded in appropriate tweets to better enable followers to stay informed. We are still working with a Twitter developer advocate to improve the automated tweeting experience and the information presentation through the use of IoT platforms (Internet of Things).
There are other potential uses and applications for getting gaging station information directly to the general public via social media. One of the driving forces in this particular case (and for potentially many others around the world) was the additional cost related to building a network or infrastructure to get data from the gaging station to a traditional flood-warning base station computer system and the ongoing maintenance efforts and costs for those networks and systems. The designers of this system believe this general approach can be a great option for small municipalities or communities with reliable cell phone coverage. However, this solution could also be adapted for satellite or spread-spectrum license-free radios.
*Doocy S, Daniels A, Murray S, Kirsch TD. The Human Impact of Floods: A Historical Review of Events 1980-2009 and Systematic Literature Review. PLOS Currents Disasters. 2013 Apr 16. Edition 1. doi: 10.1371/currents.dis.f4deb457904936b07c09daa98ee8171a.